Debugging in the Simulator
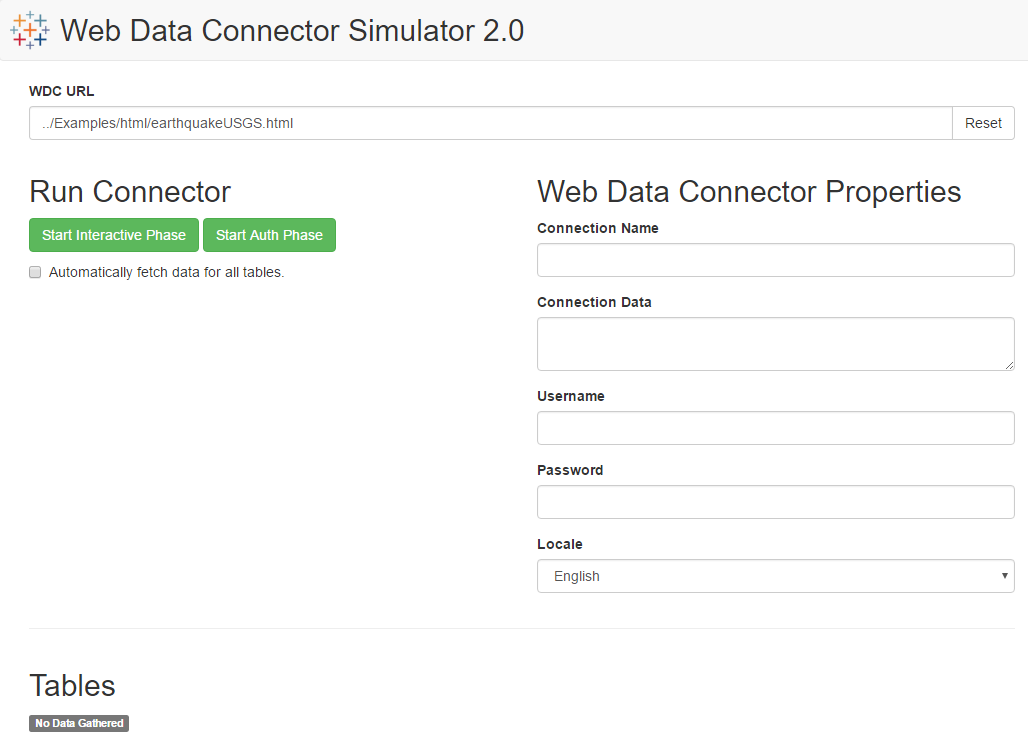
You can use the simulator included with the WDC SDK to develop and debug your connectors more quickly. The simulator is a JavaScript application that loads connectors in a similar way to MAPS.
Use the simulator when you are developing your connector, to set breakpoints in the browser, view network requests, and more. Use MAPS periodically during development to confirm that your connector works the same as in the simulator, and then to perform your final testing.
This page includes information about developing and debugging your connectors in the simulator.
Debugging in the simulator
To set up and run the simulator, follow the instructions in the Get Started section.
When you run a connector in the simulator, only the getSchema and getData parts of your connector code
run in the simulator window. The interactive phase and authentication phases run in a separate window. This means that
messages that you print with console.log will appear in different browser consoles.
To print messages from both windows to the console for the main simulator window, use tableau.log. For example, you
might enter the following in your code:
tableau.log("My console message goes here!");
Simulator tips
-
By default, the test web server runs on port 8888. To change the port number, edit the
http-serverscript in thepackage.jsonfile. For example, you might enter the following to change the port to 8000:"http-server": "node node_modules/http-server/bin/http-server -p 8000" -
To make it easier to load files into the simulator, keep the simulator and web data connector .html files that you are testing in the same folder.
Caching in the simulator
If changes to your connector do not appear to take effect in the simulator, the browser might be caching a previous version of your connector. Here are some ways to work around caching issues:
-
In some browsers, you can press Ctrl+Shift+R or Cmd+Shift+R to clear the cache for the current page and reload it.
-
Open the simulator in an incognito window which does not store cookies or cache pages. Note that the list of recent connectors will not be stored if cookies are disabled.
-
In Google Chrome, you can disable caching while the developer tools are open.
-
Open Chrome Developer Tools.
-
Press F1 to view the settings.
-
On the Preferences tab, under Network, select the Disable caching option.
-
General browser debugging tips
-
Open the developer tools console for the browser.
For example, in Google Chrome press Ctrl+Shift+I on Windows or Command+Option+I on the Mac to open the tools pane, and then select the Console tab. In this console, you can see all the results of various console.log statements. The console also displays output from the tableau.log and tableau.abortWithError functions.
This is a good place to check for errors in case anything goes wrong. The console will display information about run-time errors (unhandled exceptions) that occur while your code is running. If an error occurs, the JavaScript engine in the browser throws an error and the error message is displayed in the console.
-
Use a debugger to step through your code.
Most browsers include a debugger as part of their developer tools. You can set breakpoints in your code in the debugger or include JavaScript
debuggerstatements. When the web data connector runs and the browser’s developer tools are open, code execution stops at breakpoints ordebuggerstatements and you can examine variables. For an overview of debugging tools, see JavaScript Debugging on the W3CSchools.com site.